PRODUCT
Rank your corridors. Start with the bike grid.
One engine turns your council’s data into a 2D digital twin of the road network, weighs risk, demand, connectivity and equity, and ranks every corridor. The first application is the separated bike grid: scored, ranked and ready to defend.
PRODUCT TOUR
One workspace, from the first file to a brief you can hand over.
01 / 07
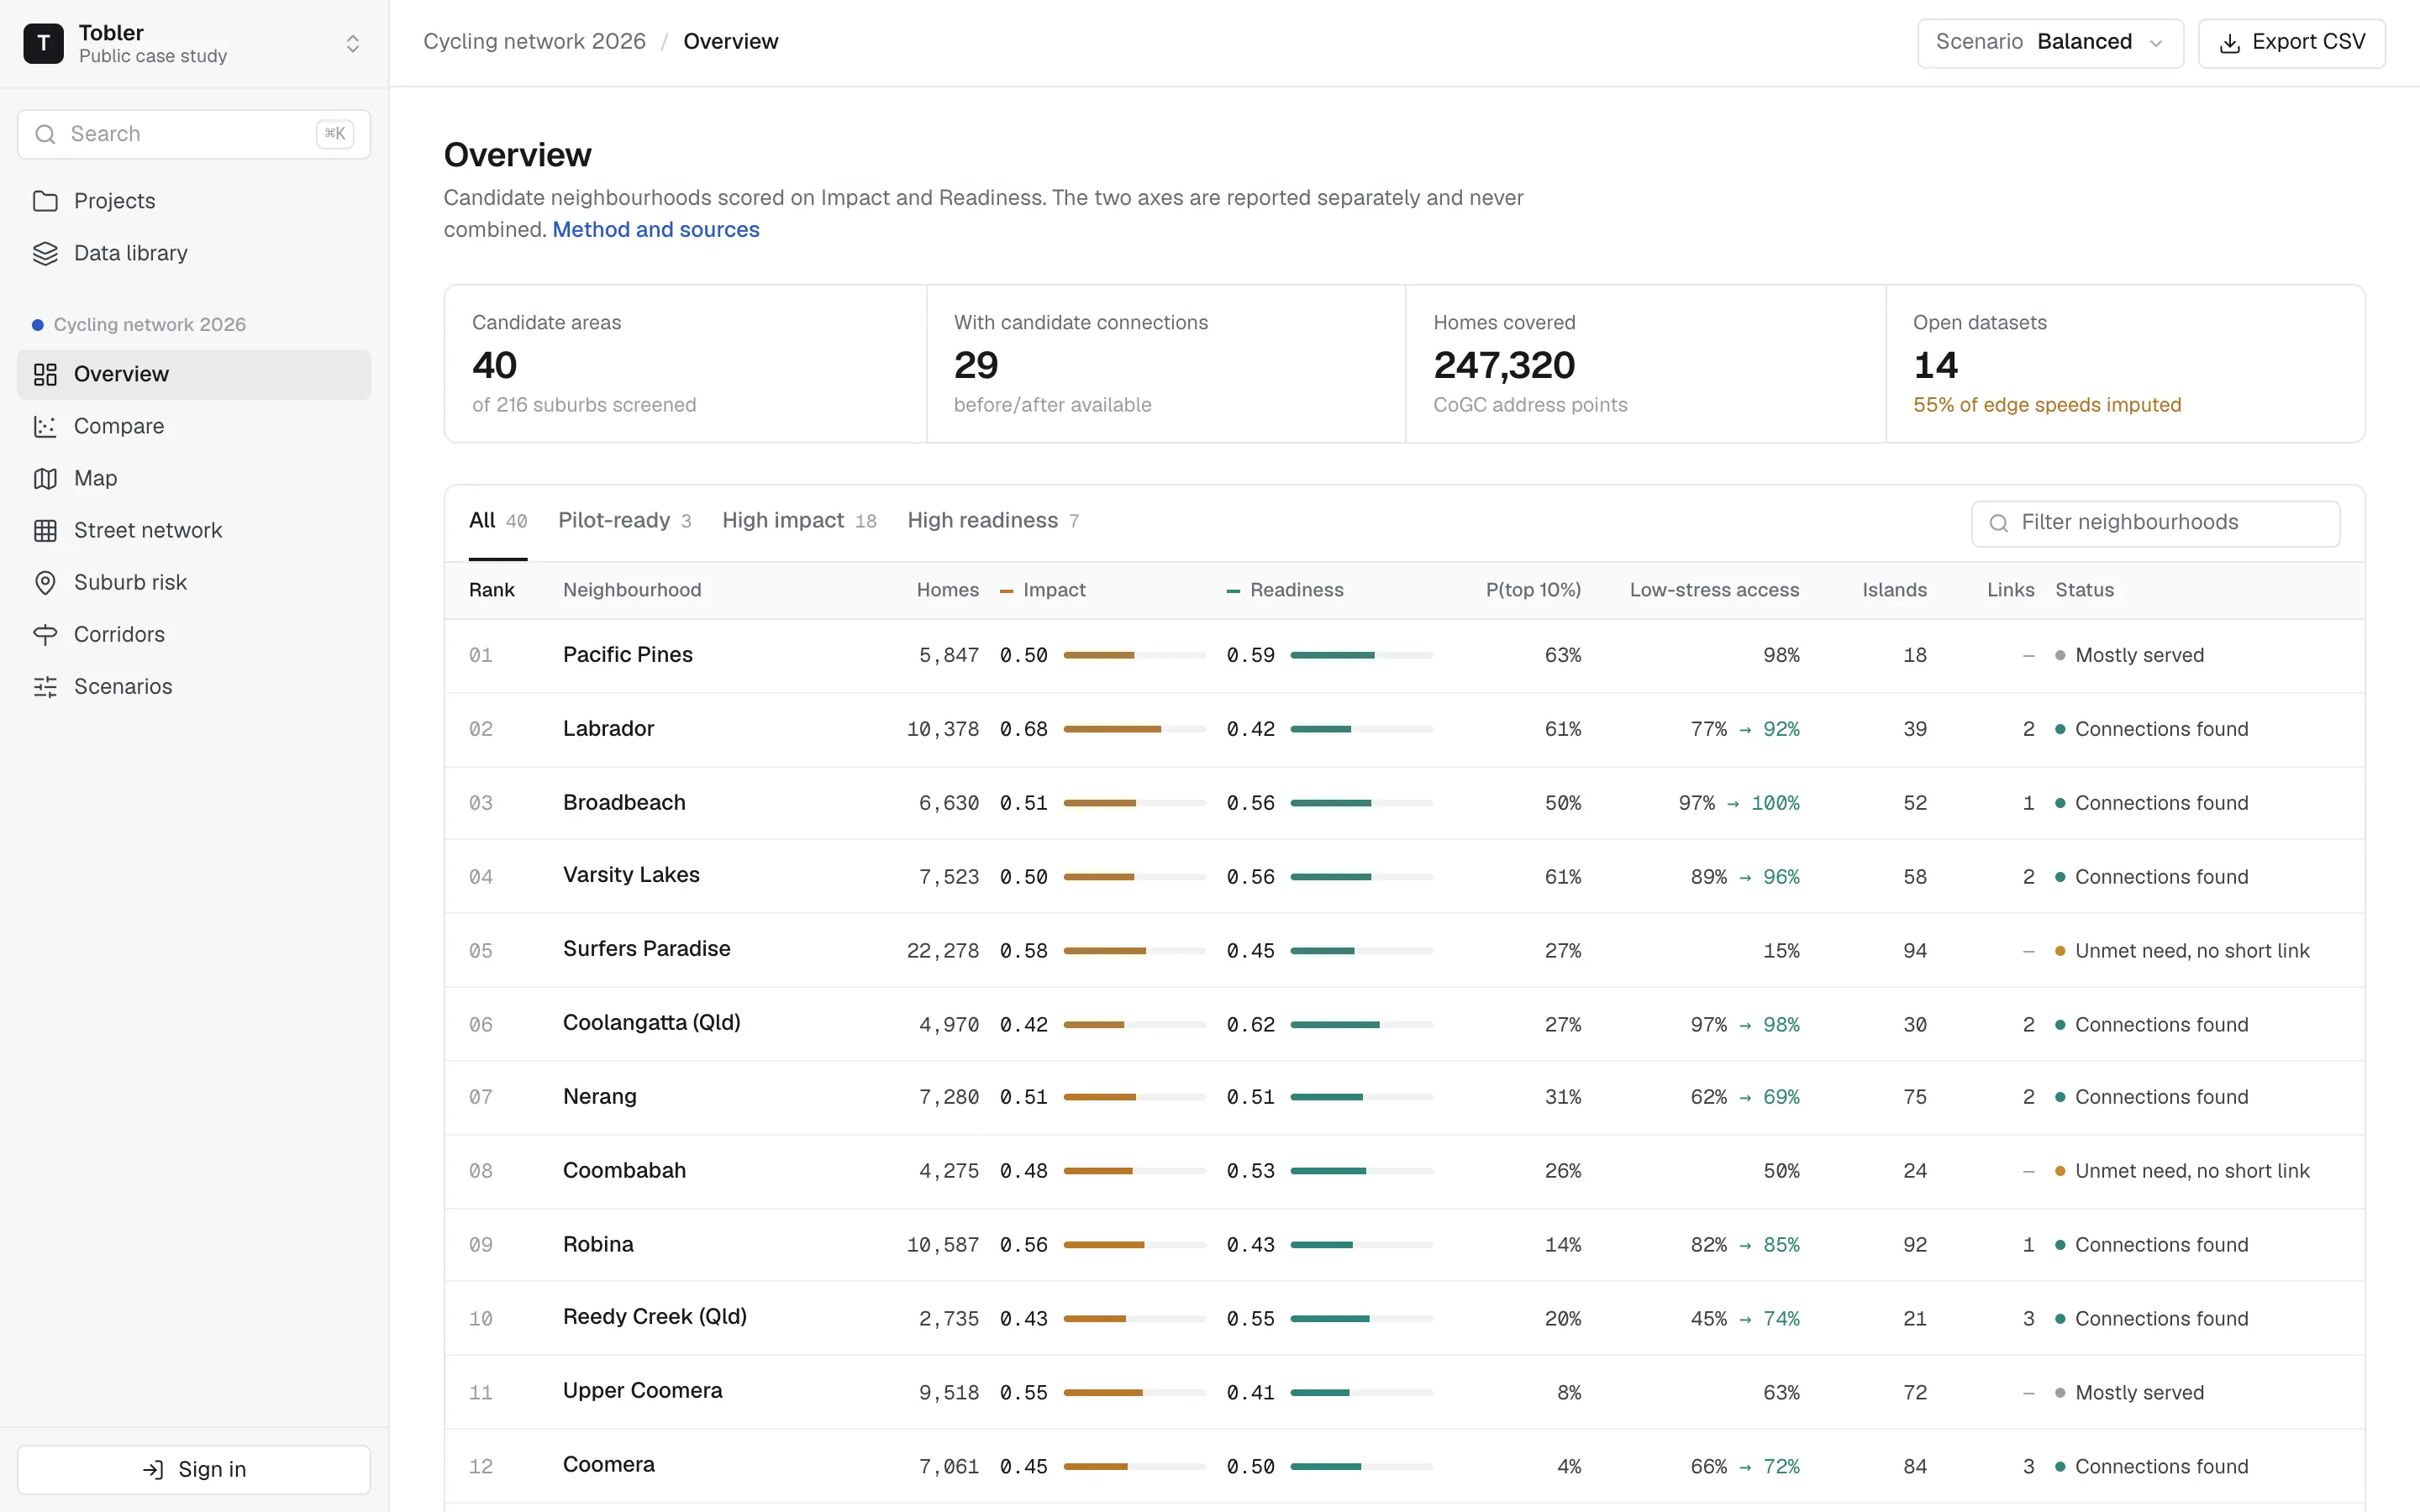
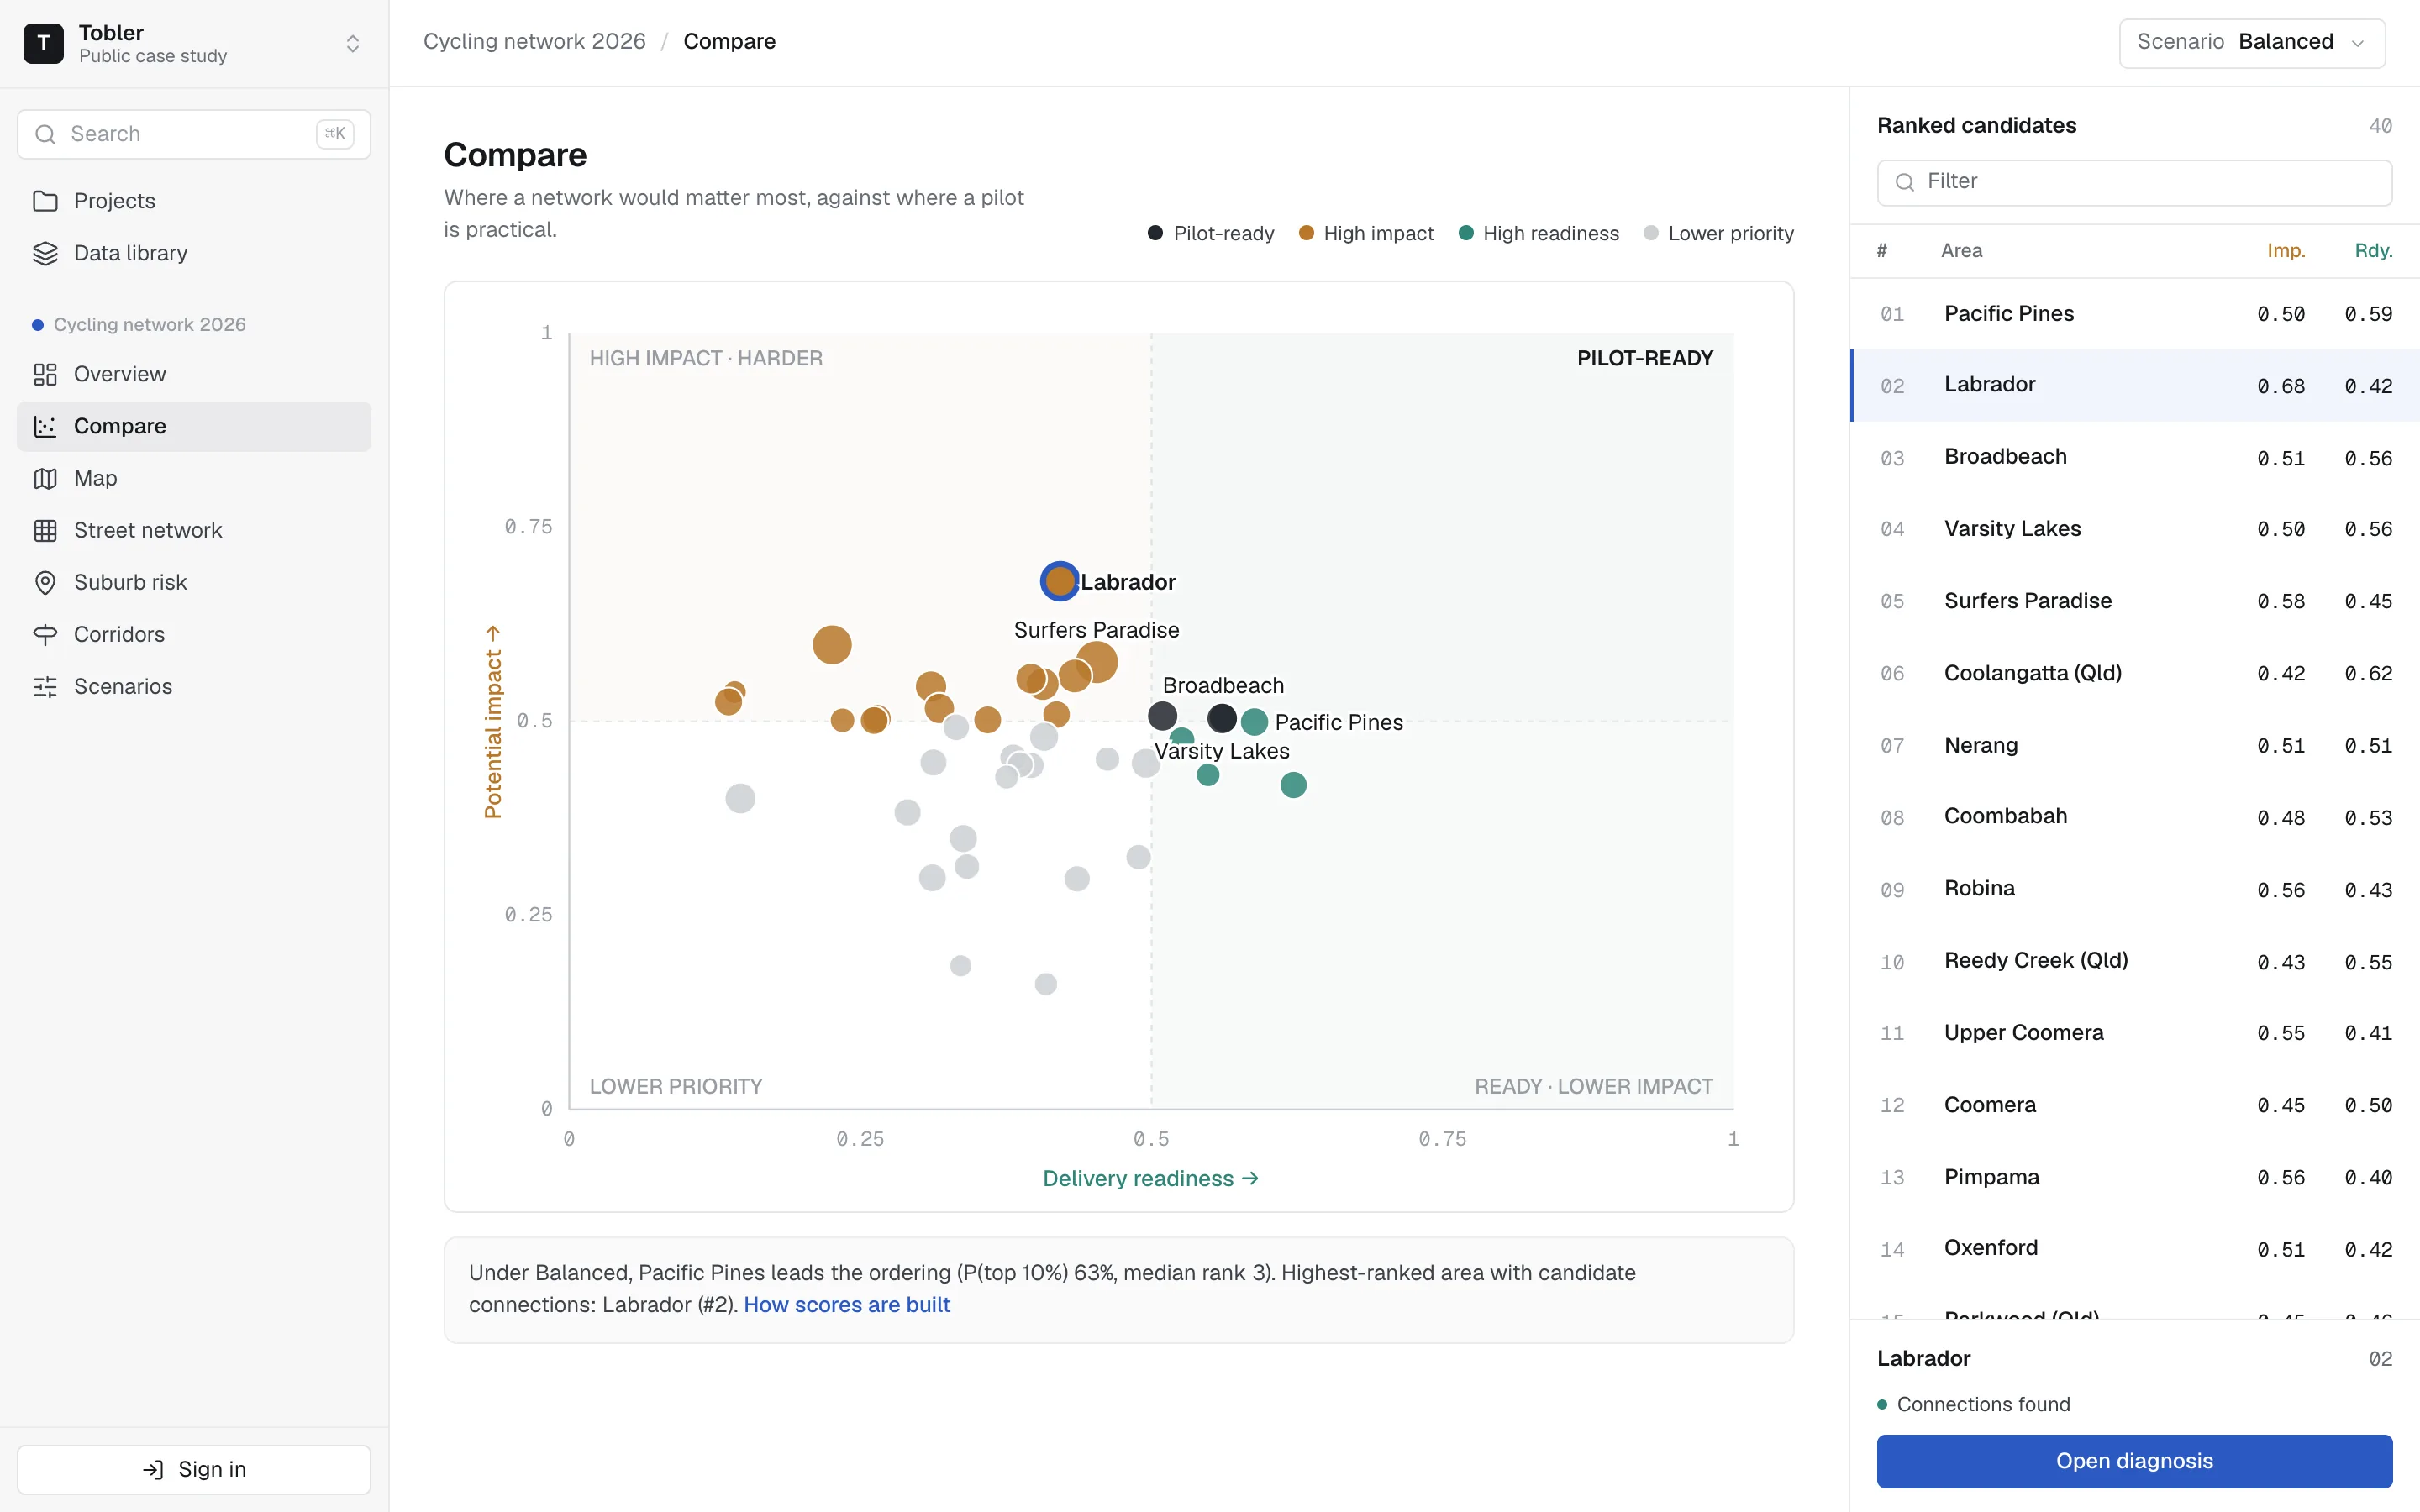
Rank every candidate, on two axes
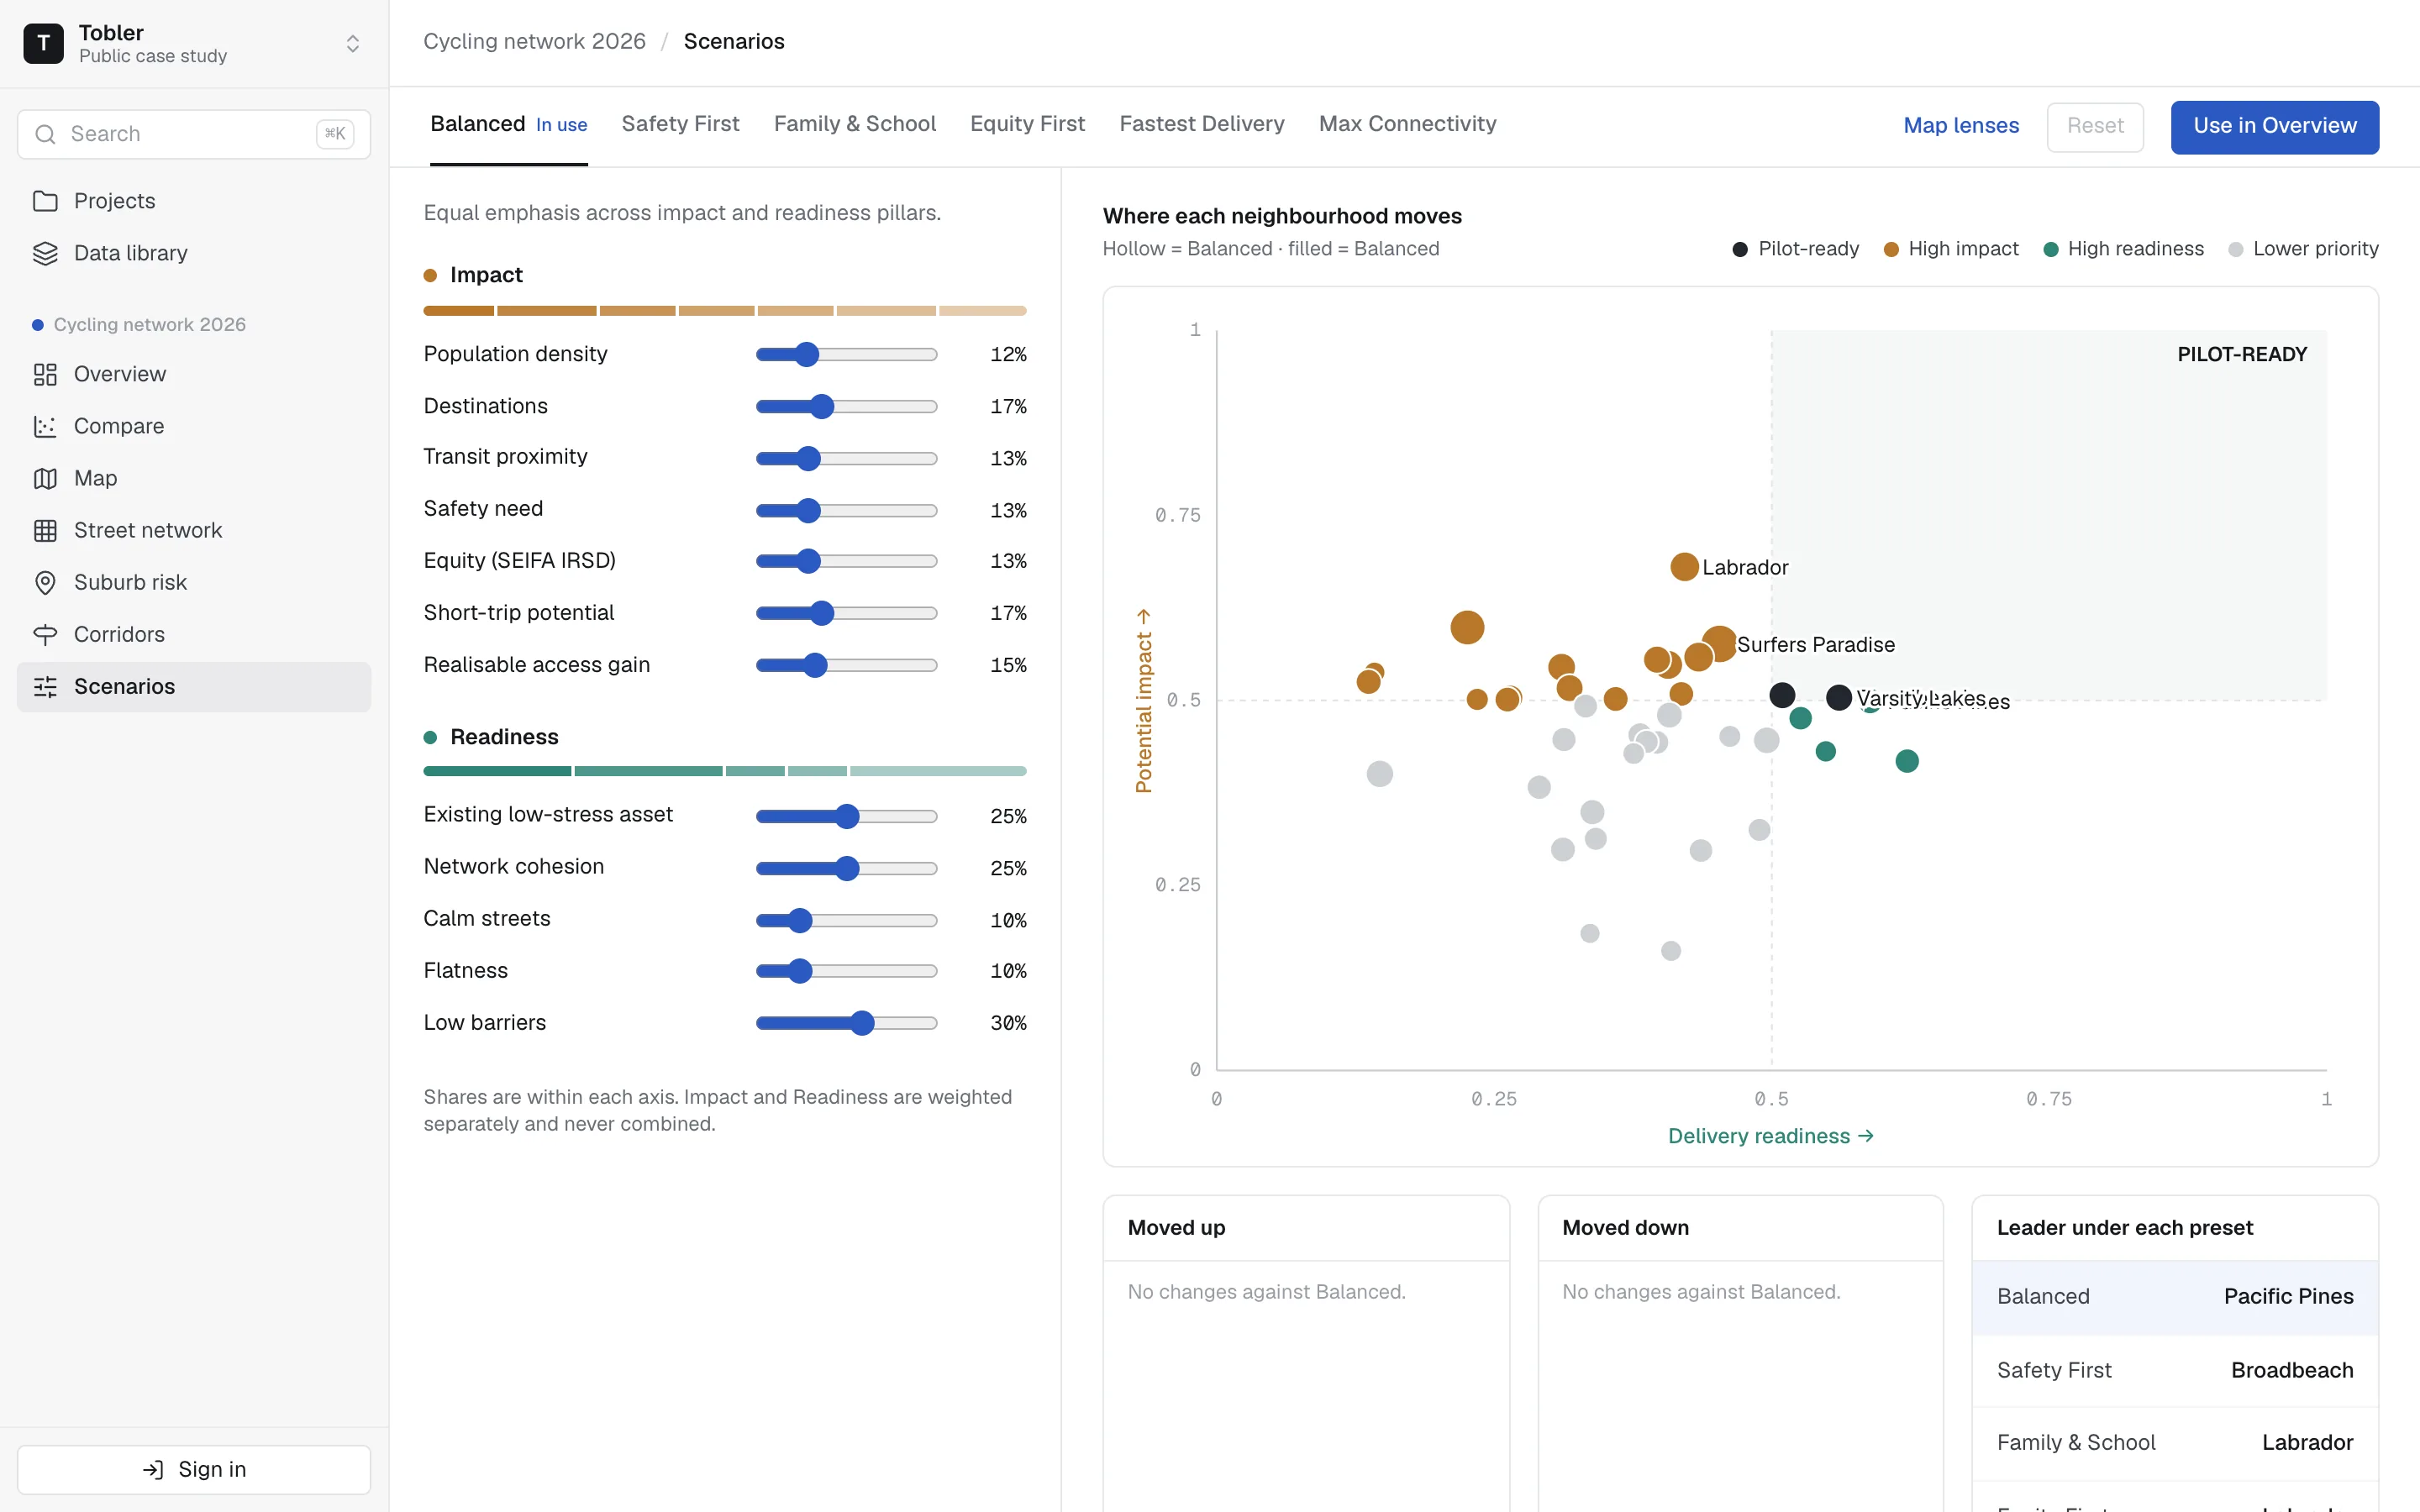
Candidate neighbourhoods are scored on Impact and Readiness, reported side by side and never merged. You can filter to pilot-ready areas, or export the table in one click.
EVIDENCE
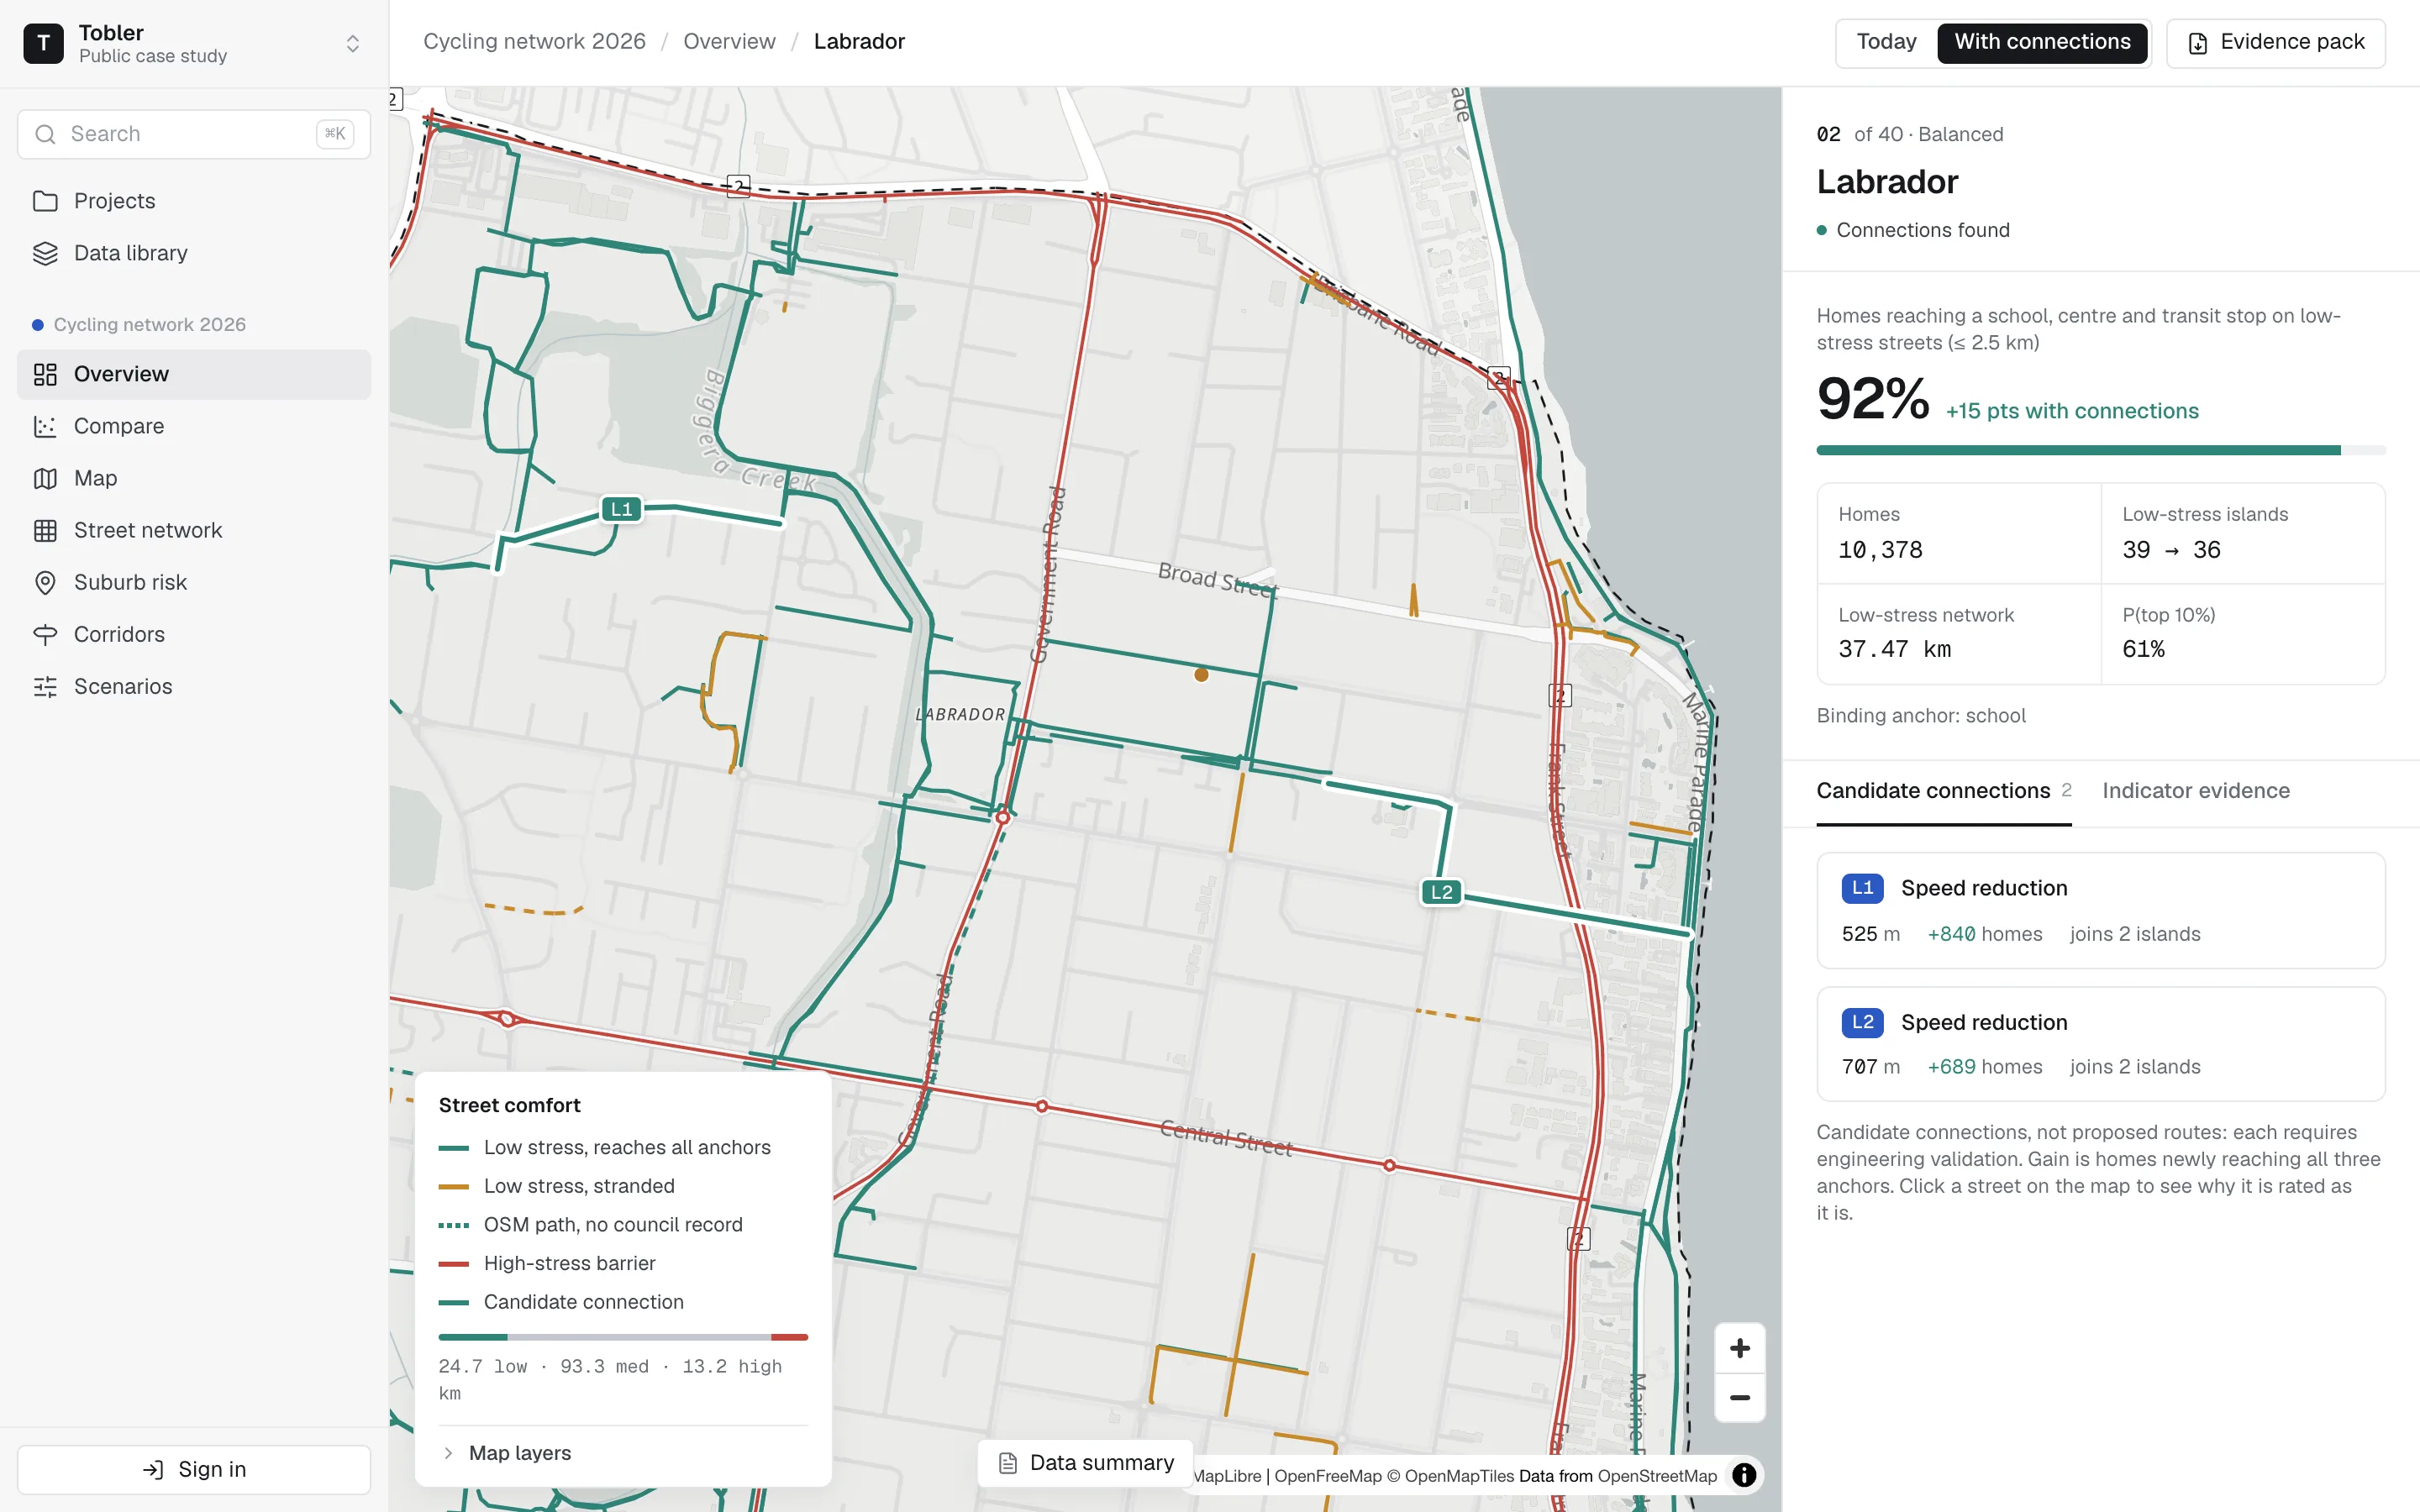
Built to answer "why this one?"
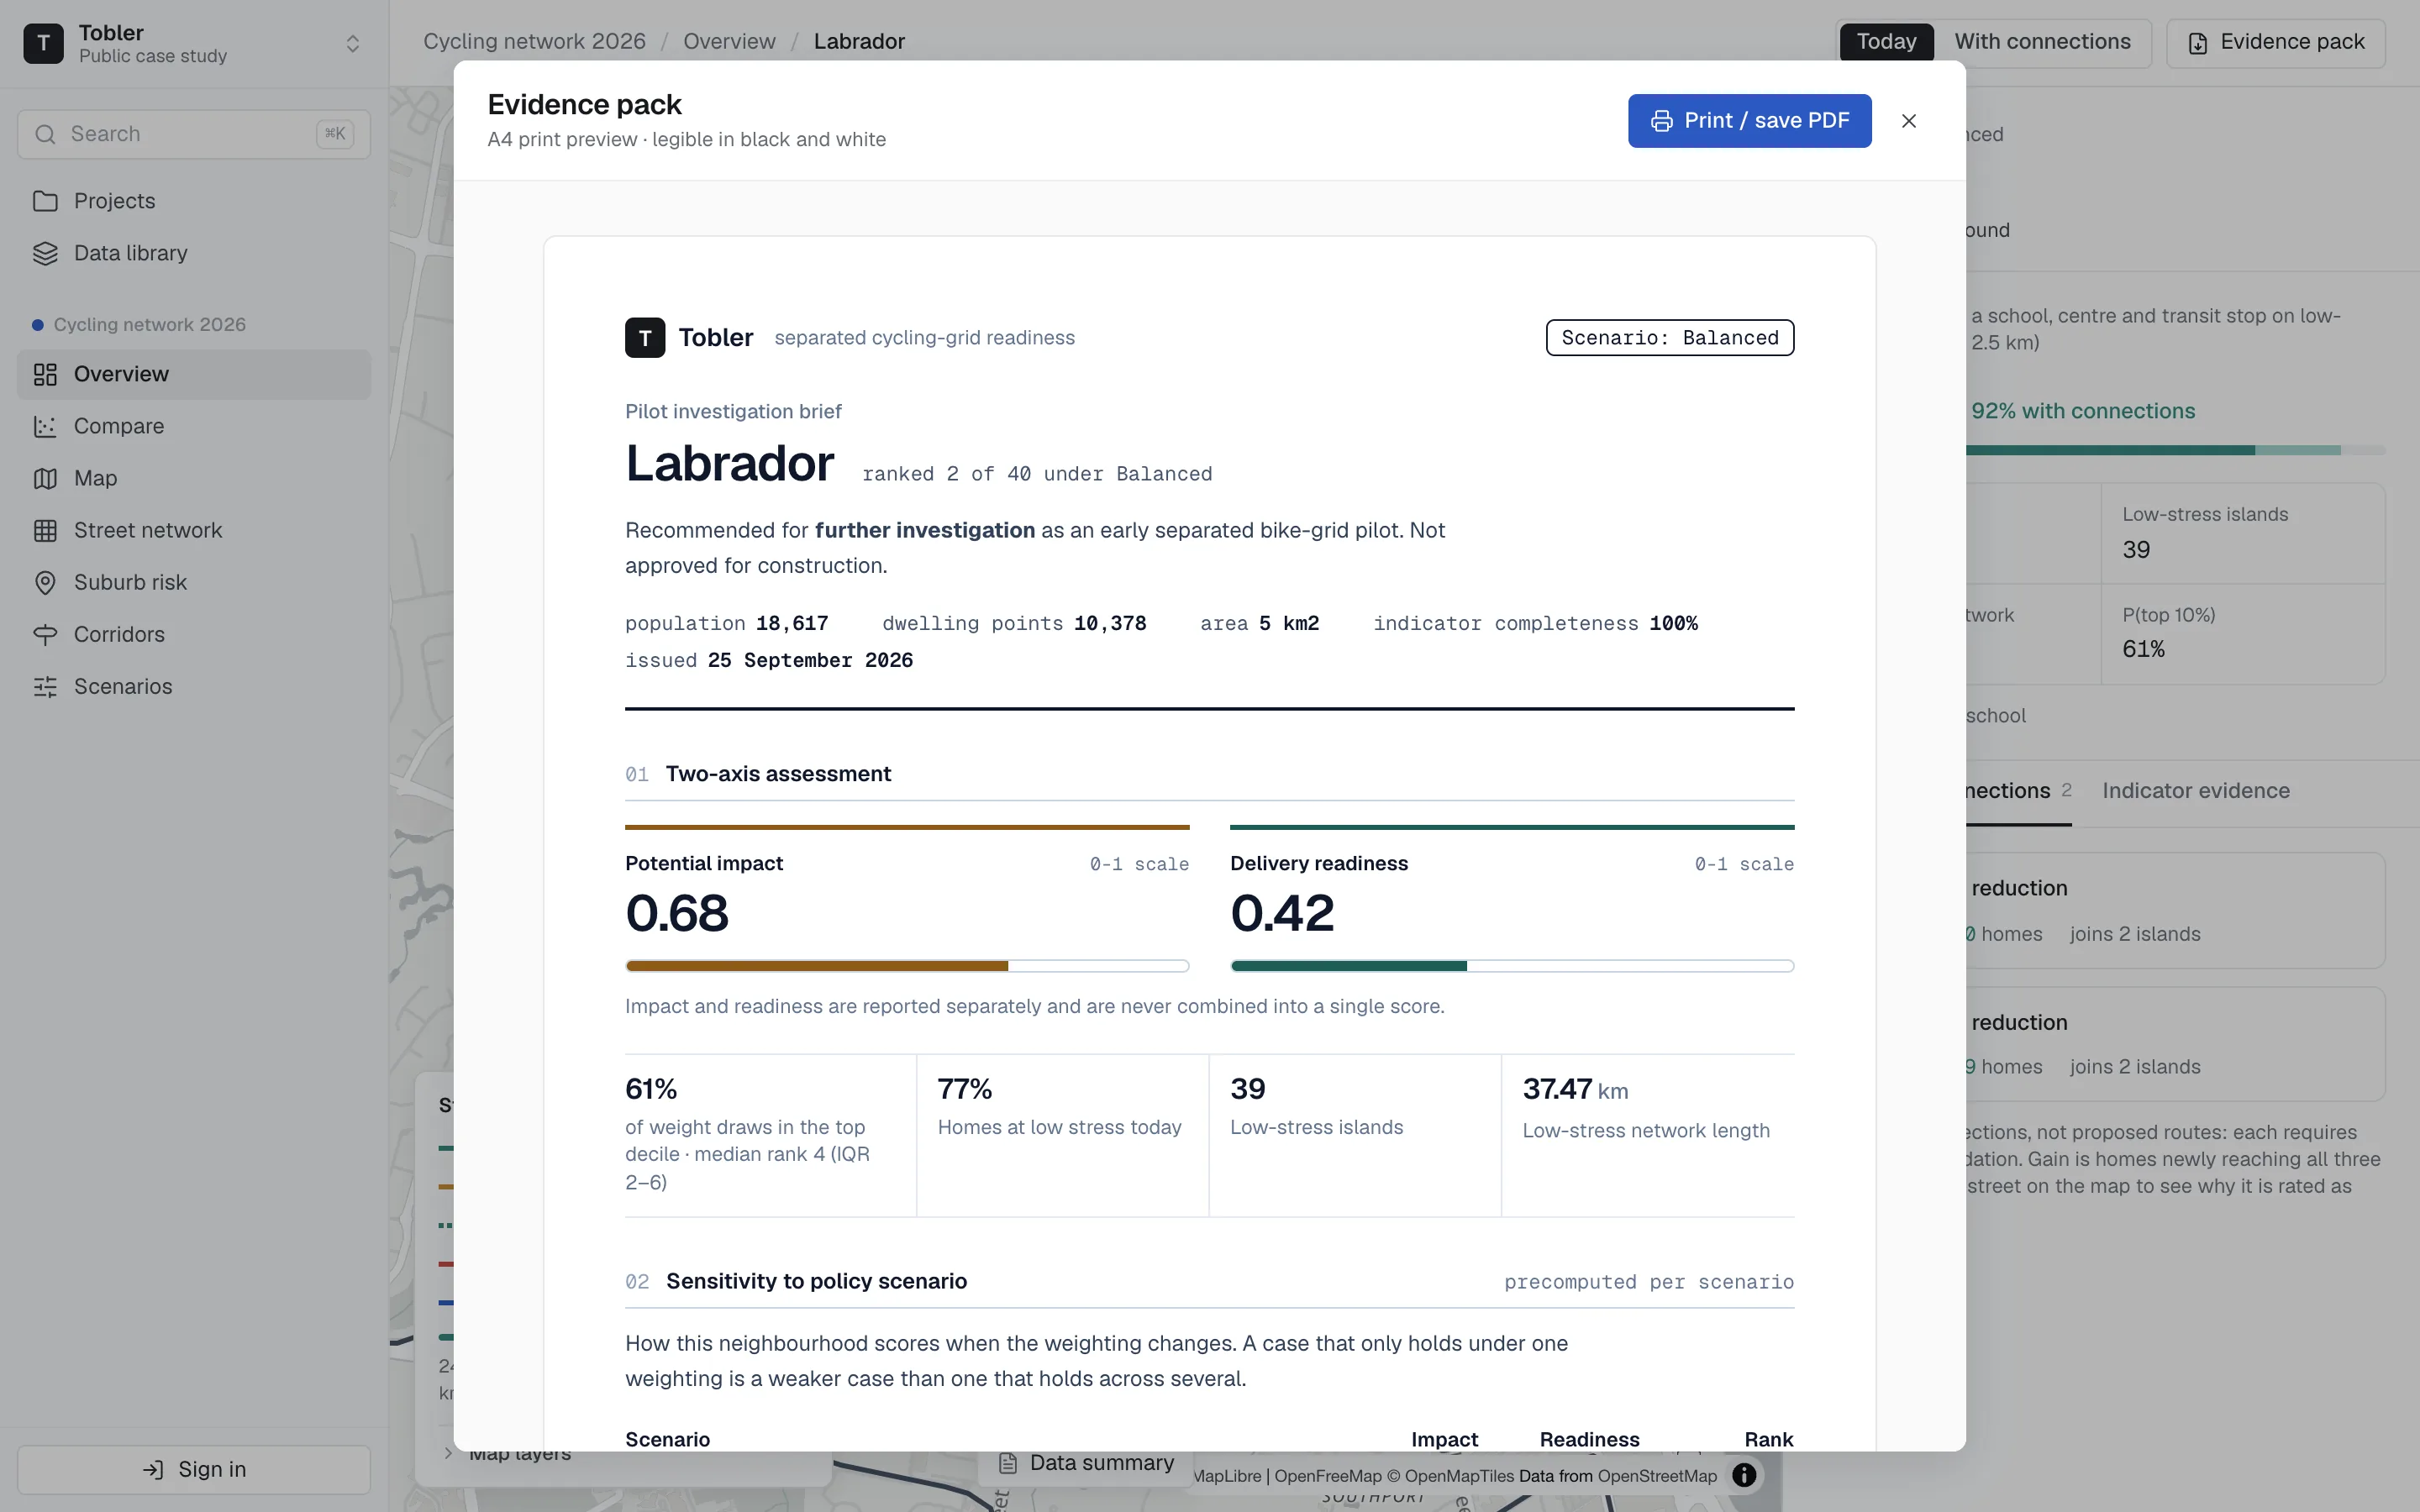
Impact and Readiness are scored separately and never combined into one number. Each indicator shows its value and its weight, and it traces to the layer it came from.
Two axes, never merged
Impact and Readiness are reported side by side, so a trade-off stays visible.
Weights on screen
Each indicator shows its score and its share of the axis.
Stress-tested
P(top 10%) comes from 2,000 random re-weightings.
Gaps are flagged
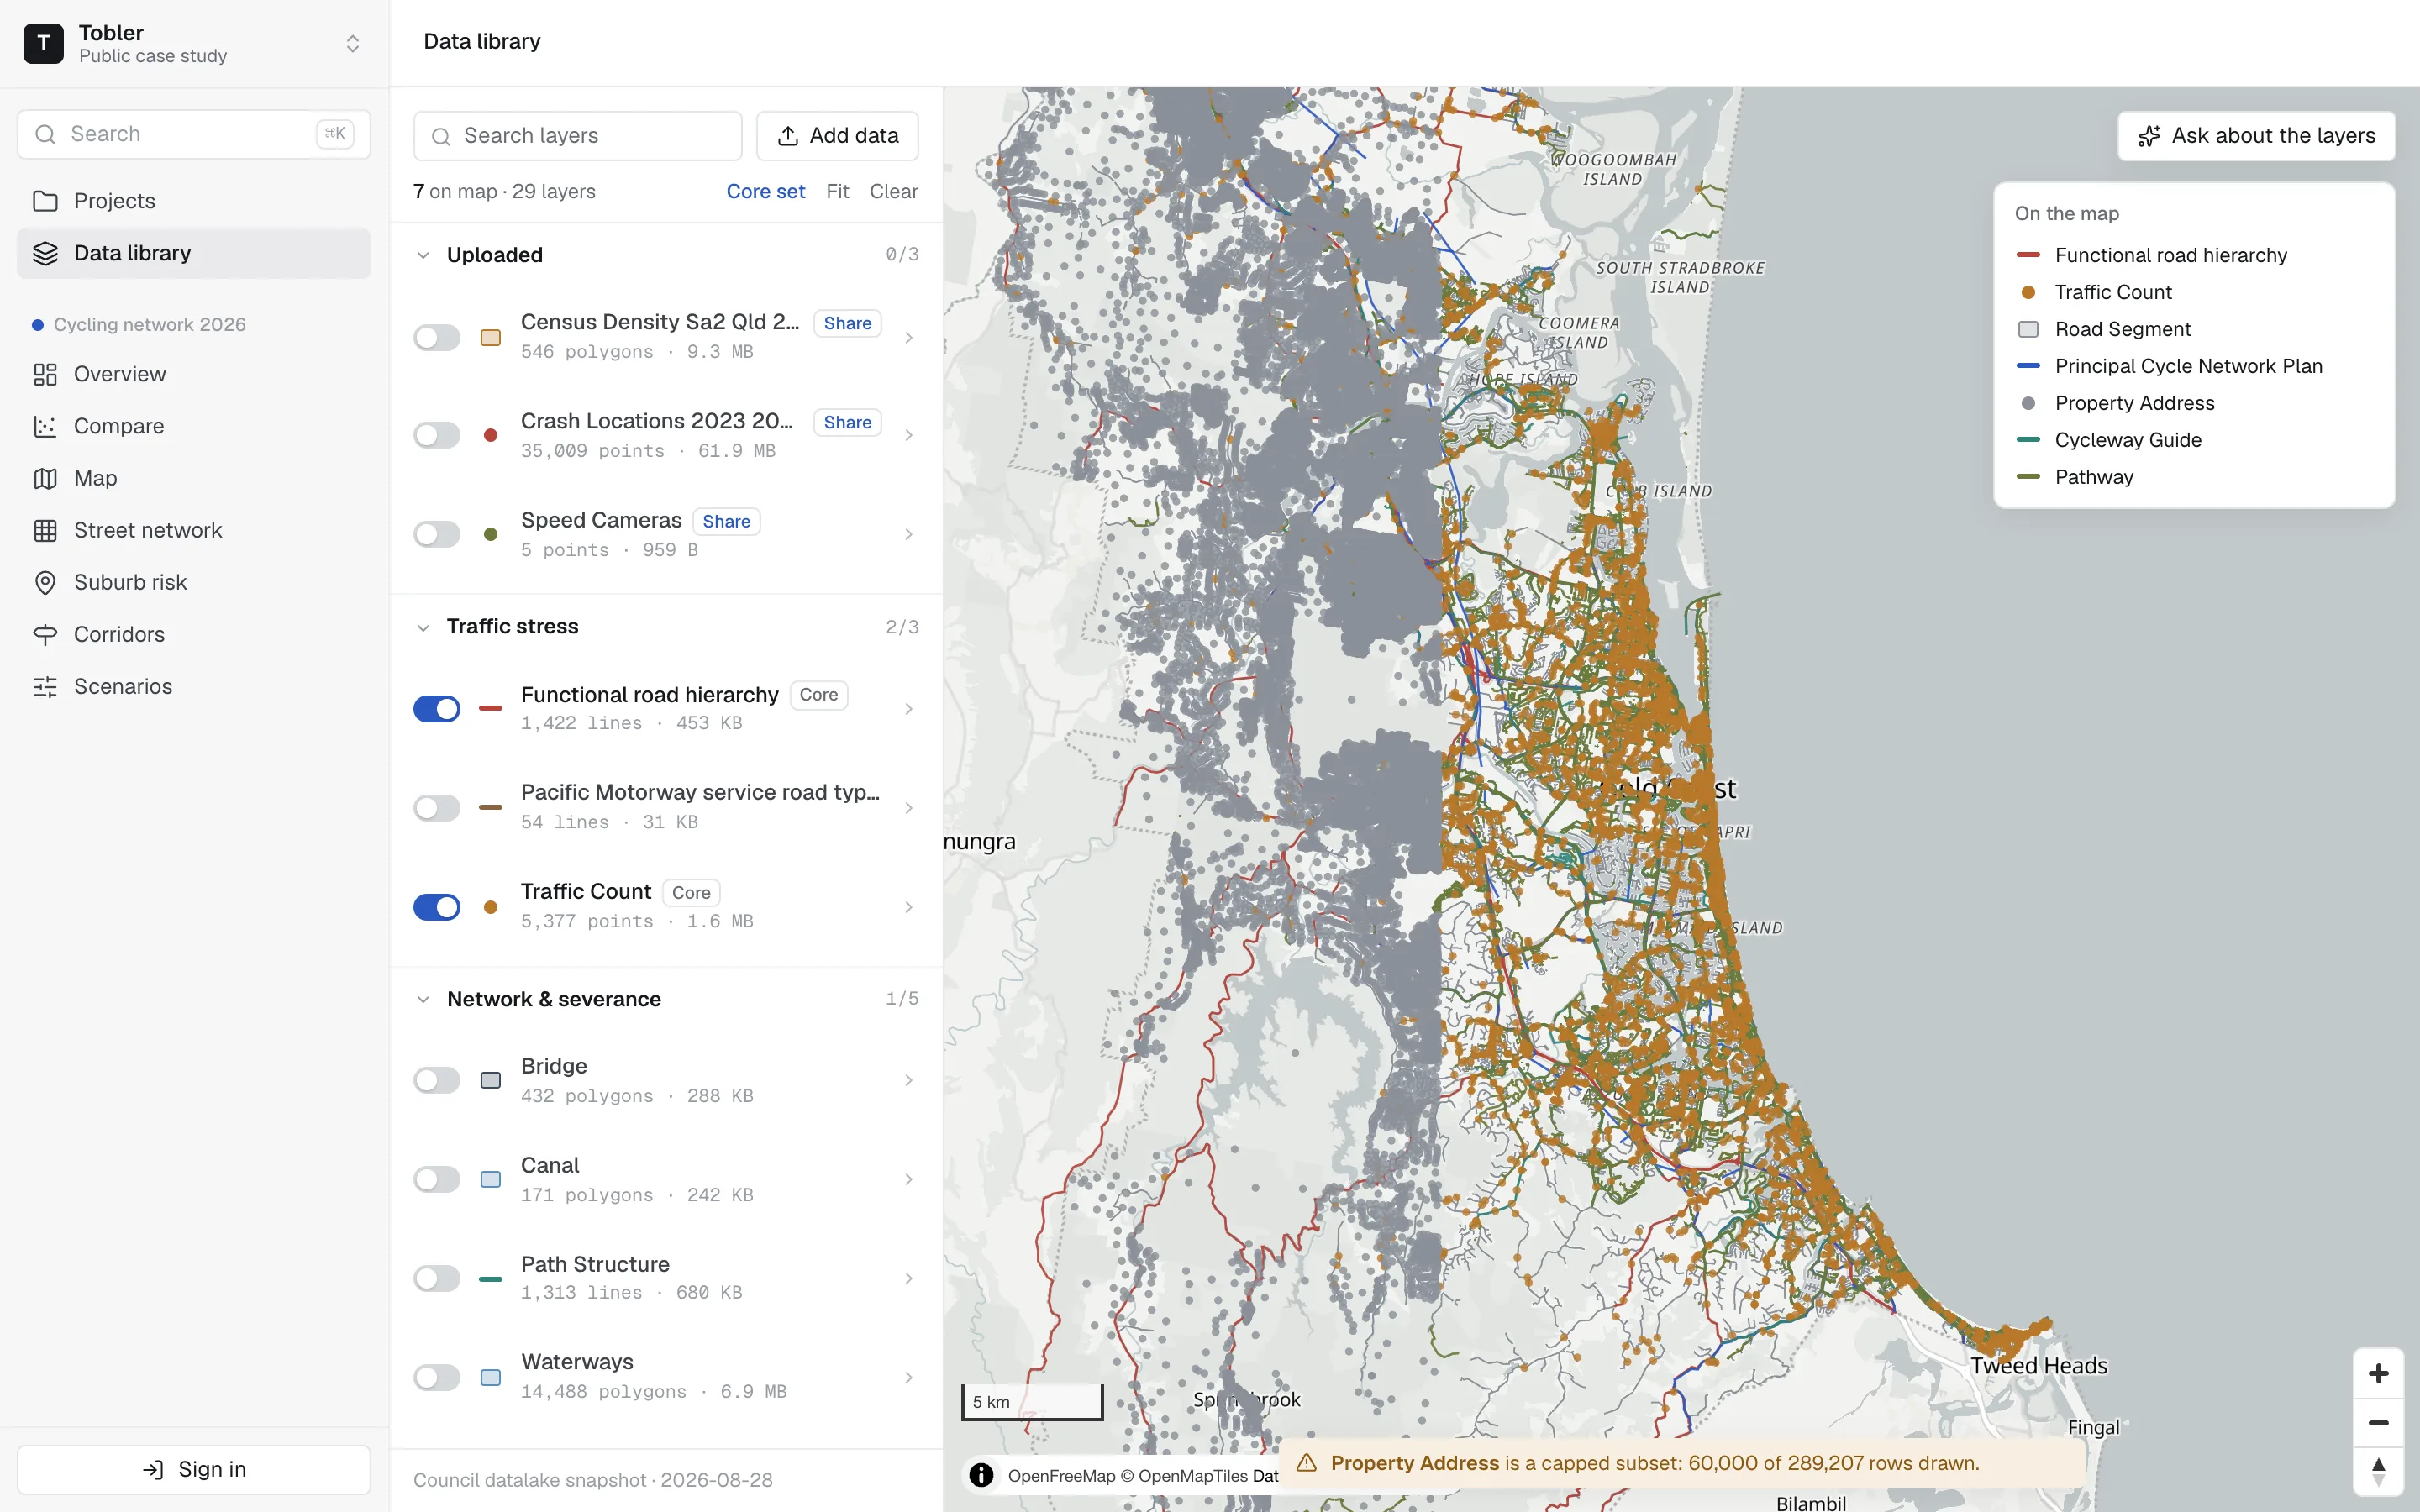
Imputed speeds and capped layers are marked, never hidden.

Built around your council.
Answerable to the evidence.
You set the terms
The weights are yours, and they are on screen. Change them and you can see who moves.
Nothing hidden
Imputed values and capped layers are flagged where they appear, never smoothed over.
Your data stays yours
Uploaded layers stay in your council’s workspace. You choose who can see them.
Reuse what works
Layers, ratings and scenarios from one project carry into the next.